Shannon River Flood Intelligence
A decade of Synthetic Aperture Radar (SAR) insights tracking flood dynamics, hydrological shifts, and risk signals across Ireland's longest river.
Problem Statement
The River Shannon experiences frequent winter flooding, exacerbated by heavy rainfall, leading to widespread inundation of adjacent lands. This was notably severe during the 2015–2016 floods, affecting areas like Limerick, Galway, Mayo, Roscommon, and Offaly (e.g., Shannonbridge), with maximum extents reaching ~24,356 hectares. SAR satellites enable rapid, high-resolution (10m) mapping of flood extents, persistence (e.g., tracking unchanged flood levels over months), and dynamics, even under persistent cloud cover that hinders optical imaging.
Leveraging Synthetic Aperture Radar data allows consistent, high-resolution flood mapping and temporal analysis, regardless of weather or daylight conditions. This project aims to identify and track emerging flood hotspots along the Shannon River, supporting proactive risk management and resilience planning.
Decadal Flood Extent Timeline
Scroll or watch the sequence: yearly SAR-derived flood composites along the Shannon.
Data illustrative; integrate SAR composite tiles or dynamic map for production.
How We Derive Flood Intelligence with SAR
Synthetic Aperture Radar (SAR) penetrates cloud cover and operates independent of daylight. We combine calibrated backscatter, coherence change detection, and temporal compositing to produce a robust flood extent signal even under persistent Atlantic weather systems.
Radiometric Calibration
Standardize backscatter (sigma nought) to compare multi-orbit acquisitions across years.
Speckle & Noise Reduction
Multi-temporal filtering + adaptive Lee refinement stabilizes water surface signatures.
Water Classification
Hybrid threshold + ML segmentation separates open water, saturated soil, and emergent vegetation.
Change Detection
Coherence + differential backscatter highlight rapid inundation vs gradual expansion.
Time-Series Composites
Windowed aggregation reduces false positives and seasonal noise for annual snapshots.
Metric Extraction
Flood extent polygons + hydrodynamic indices feed trend analytics and risk scoring.
Workflow: Sentinel-1 SAR imagery processed in Google Earth Engine and refined in QGIS to analyze backscatter, map flood extents, and trace floodplain dynamics.
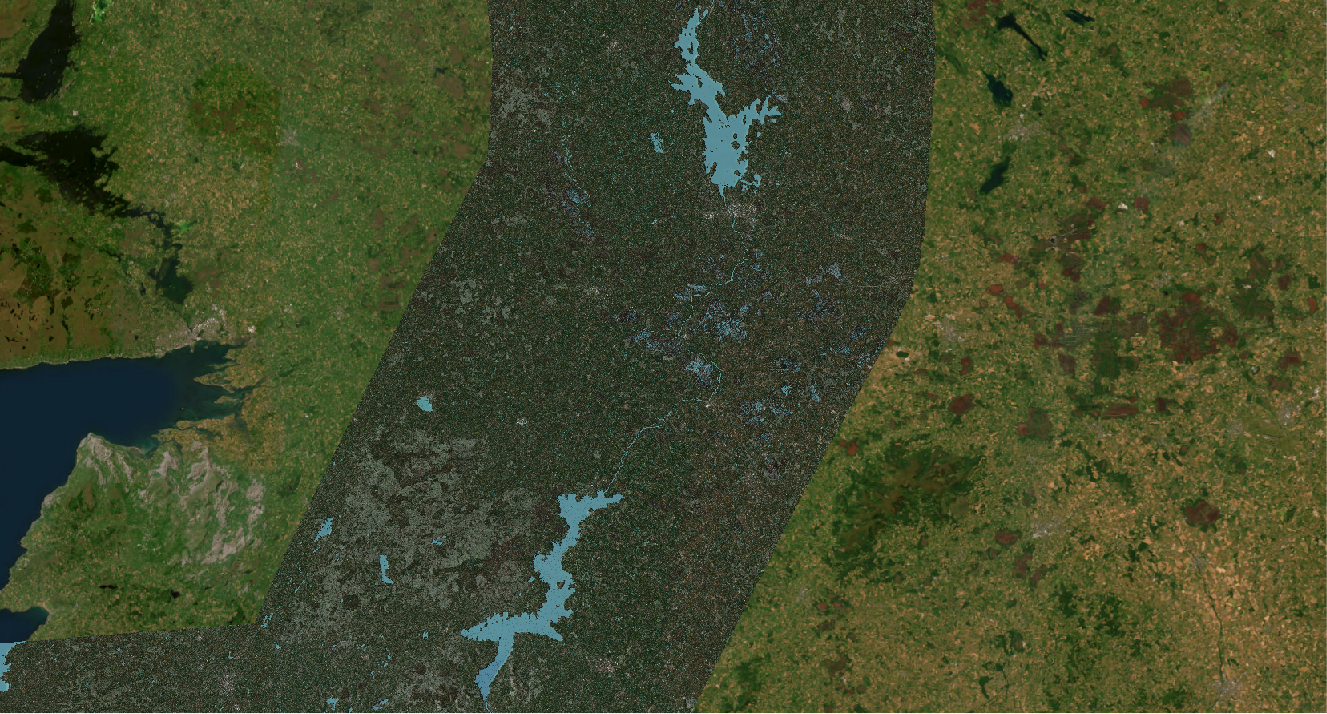
Year 2015 Snapshot
Severe winter flooding (sim.); prolonged high stages along callows; minor embankment overtopping in spots.
- Flood Extent190.0 km²
- Avg Level38.10 m
- Peak Level39.85 m
- Rainfall Anomaly+22%
1 / 6